
Background
As Enterprise Architects, we are frequently tasked with researching, analyzing, and recommending vendors or other resources to meet the enterprise capability requirements. For instance, it may include identifying suitable IAM platforms, Consent Management SaaS solutions, Subscription Management Vendors, or iPaaS platforms. These engagements are typically well-defined and outcome-oriented, often serving as a precursor to further vendor evaluations or the procurement process.
These engagements are specific projects in Enterprise Architecture(EA) practice. But for these engagements to be successful and to ensure that our recommendations are effective, we also need to understand the larger context in which we operate. The EA practice employs EA Standards and Frameworks and make use of EA tools to document the understanding.
Consultants may not always have access to comprehensive enterprise tools such as Orbus or Sparx, particularly when working externally. Additionally, some organizations even with established EA practices may not have developed complete, end-to-end enterprise architectural narratives. My sincere hope is that, insights shared here may prove valuable to professionals with similar experiences.
Earlier in my career, I dedicated a lot of time in such engagements to understanding the relevant enterprise landscape. The purpose of this blog is to consolidate these considerations, evaluating their relevance, advantages, and disadvantages in a single resource. I believe compiling those observations into a unified summary will be beneficial to practitioners facing comparable challenges
This blog will be in two parts
- Part 1 (This blog) – We will look at Enterprise Architecture at a high level and understand how our discussion on Capability fits into the practice. We will also discuss how the other layers of EA and elements are inter-related. We will then look at how EA modeling enhances the understanding drives actionable outcomes
- Part 2 – We will discuss how typically we would go about evaluating a business capability such as Subscription Management
EA Hierarchy
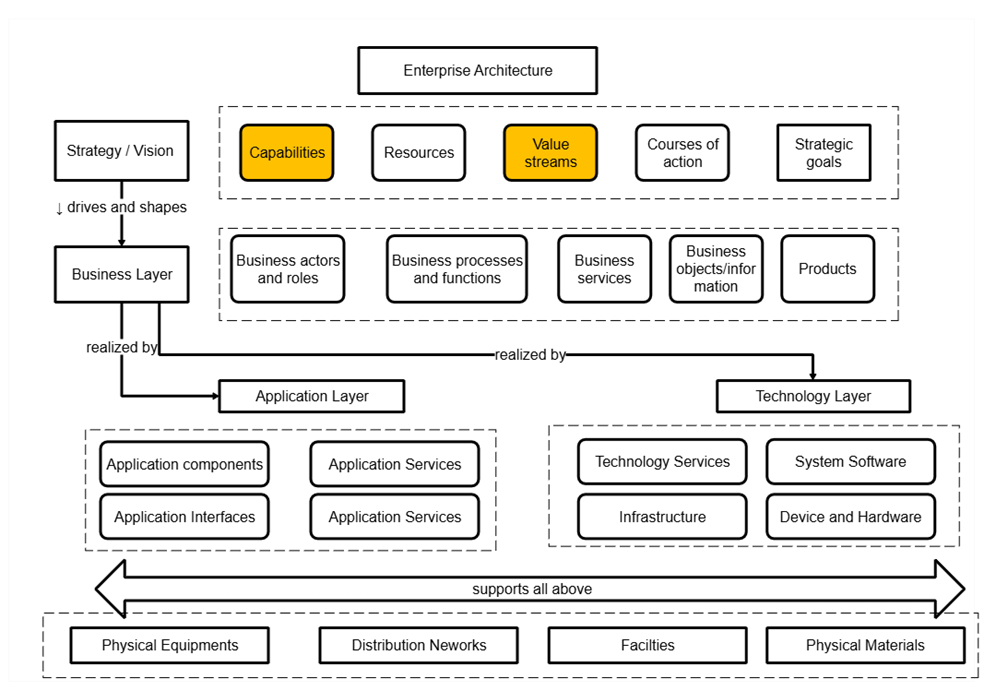
There are multiple EA Standards that are popular such as TOGAF, Zachman and DoDAF. We will be following TOGAF in this summary.
The diagram below shows the EA Hierarchy and responsibilities within each level.
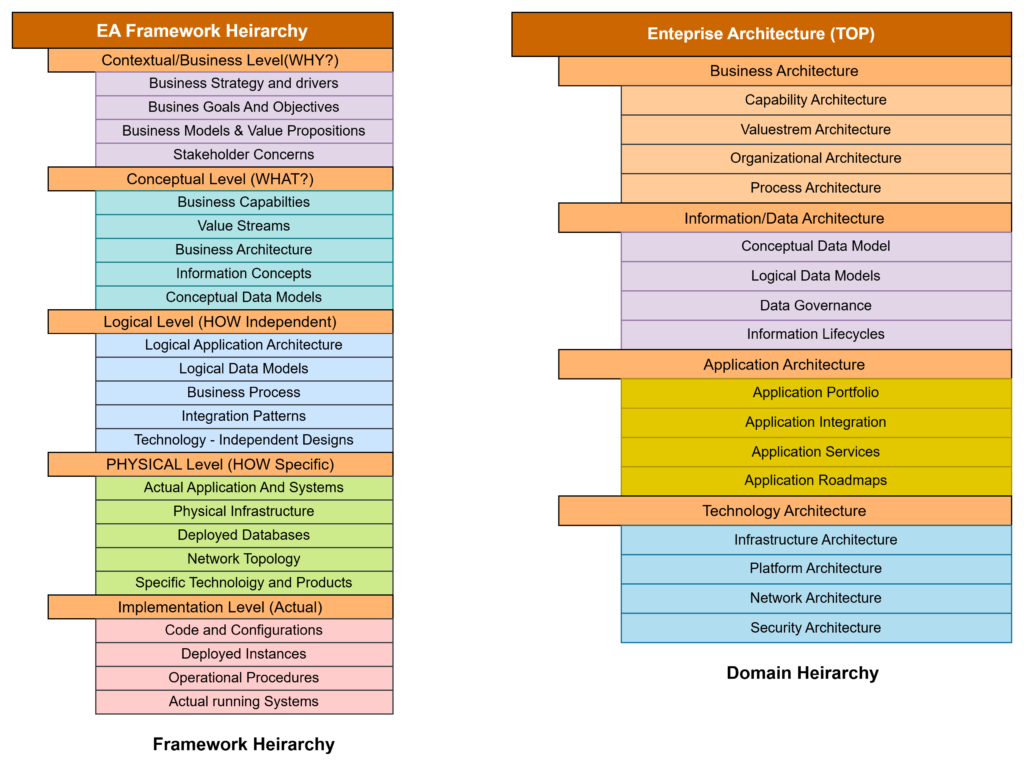
There are other alternate views on Enterprise Architecture Hierarchy. Below are examples of such views. EA Framework Hierarchy answers WHAT, WHY and HOW questions. Domain Hierarchy looks at the various domains with in the EA practice. These views enable us to help a 360 degree view of Organization and its moving parts
TOGAF recommends using ArchiMate as the modelling tool for conceptualizing EA topology. The ArchiMate Specification provides instruments to enable Enterprise Architects to describe, analyze, and visualize the relationships among business domains in an unambiguous way. The following diagram outlines the top-down approach how the EA modelling is handled with in this framework starting from Stakeholder Concern, Goals/Objective all the way to the physical infrastructure that run the applications
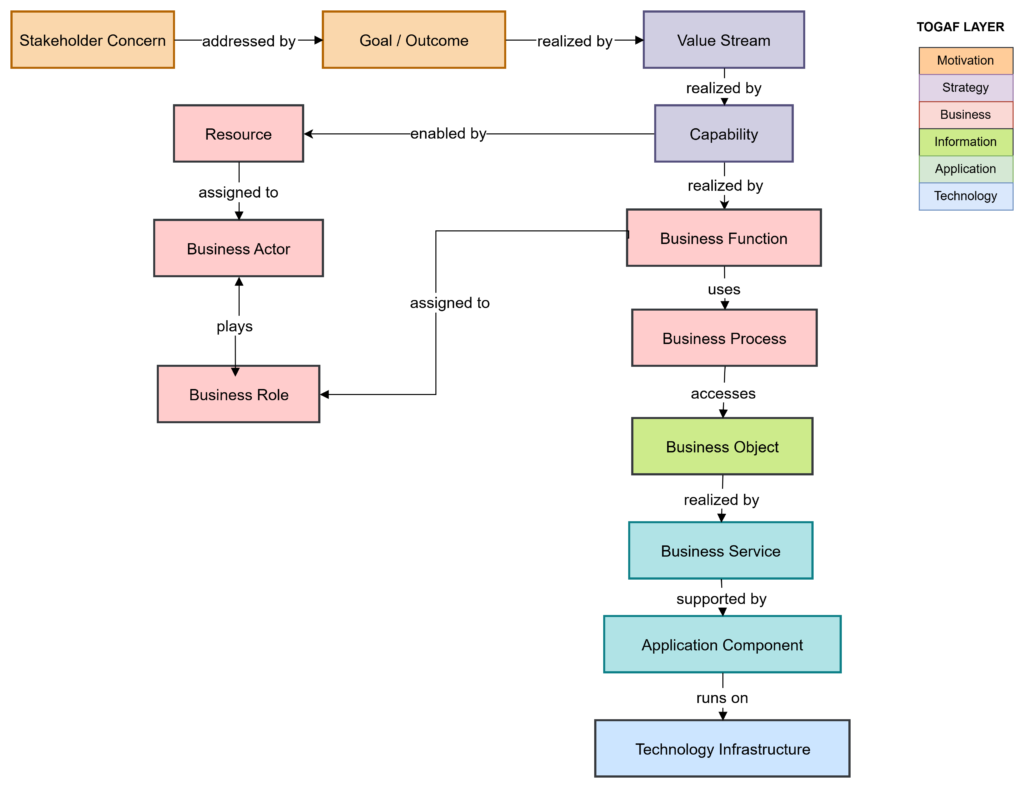
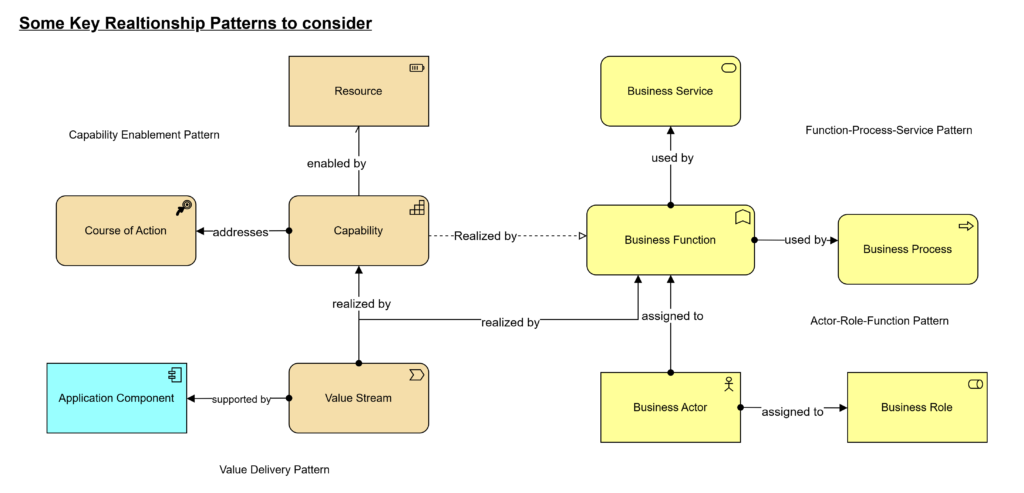
Following diagram, shows some of the familiar patterns
- Capability Enablement ⇾ relation between capability, resources, business function and course of action
- Actor-Role-Function ⇾ relation between Business Actor, Business Role and Business Function
- Function-Process-Service ⇾ relation between Business Function, Business Process and Business Service
- Value Delivery ⇾ how a Value Stream (end-to-end value) is realized by Capability and Business Function
Value Streams and Capability Mapping
Capability and Value Streams are part of TOGAF strategy that studies how an organization delivers value to its customers. Please refer to ArchiMate® 3.2 Specification for detailed information on Strategy Layer. Strategy elements of Enterprise Architecture(EA) focuses on modeling the strategic directions and choices available for an enterprise. It is used to elaborate the way the enterprise wants to create value, the capability that it needs for it and the resources that are required for the capabilities.
Resources represents the asset owned or controlled by an individual or organization. Due to resources being limited, they can often be a deciding factor for choosing which strategy, goal, and project to implement and in which order. Resources can be classified in different ways; including tangible assets, intangible assets, and human assets.
A Capability represents the ability that an organization, or it’s structural element, posses to achieve the objectives. The key characteristics determining a capability are:
- What, not How – Describes what the organization can do, independent of how it does it (e.g., “Customer Onboarding,” not “CRM System”)
- Stable over time – Capabilities change slowly compared to processes, systems, or organizational structures
- Business-focused – Expressed in business language, not technical terms
- Strategic element – Part of TOGAF’s Strategy Layer in ArchiMate, connecting business strategy to execution
Capabilities are enabled by resources (people, processes, technology, information), are realized by business functions and services, and they realize value streams. They are also Organized in levels (L1, L2, L3) from broad business domains down to specific abilities
A Value Stream represents an end-to-end collection of activities that create and deliver value to stakeholders (customers, partners, or internal users). The key characteristics are:
- Purpose-driven – Focuses on delivering a specific outcome or value proposition (e.g., “Fulfill Customer Order,” “Onboard New Employee”)
- Cross-functional – Spans multiple organizational units, processes, and capabilities to achieve the end result
- Stakeholder-centric – Defined from the perspective of who receives value, not internal organizational structure
- Strategic element – Part of TOGAF’s Strategy Layer in ArchiMate, linking business strategy to operational execution
Value streams are realized by capabilities, and Multiple capabilities work together to deliver a value stream. The key difference between a Value Stream and a process is that the former represents What value is delivered and to whom (outcome-focused) and the latter decides How the work is done, step-by-step (activity-focused)
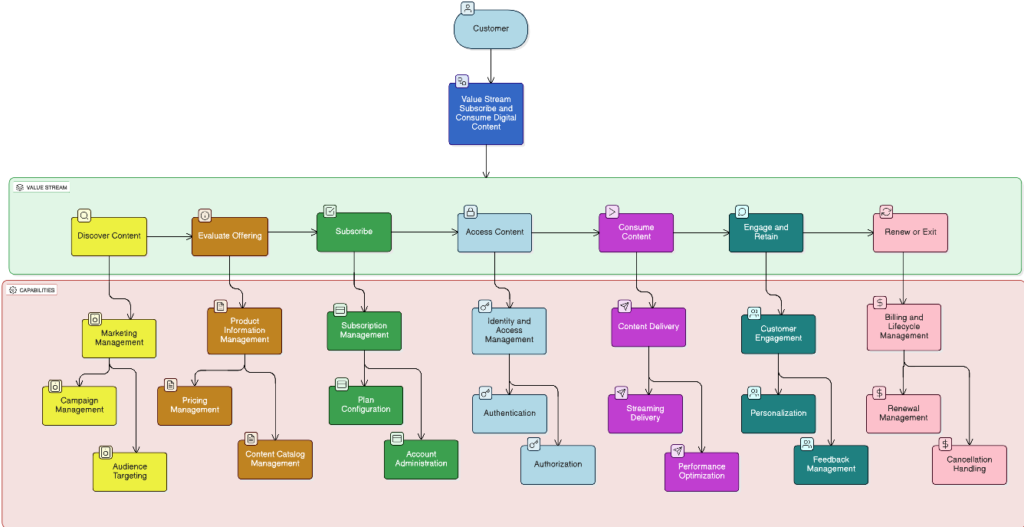
Let’s look at a digital media subscription scenario, in which the value stream as shown in the diagram delivers value end-to-end. The value stream starts from awareness to ongoing engagement program all the way to program renewal or exit. Each Value Stream stage is supported by capabilities, which are shown at two levels. Each value stream stage shows a sequential process, with value delivered at each stage. Capabilities are not sequential; they are organizational abilities that enable multiple value streams.
This flow outlines the end-to-end journey of a customer subscribing to and consuming digital content. The process begins with the customer discovering available content and evaluating the offering. Upon deciding to subscribe, the customer gains access to the content, consumes it, and engages with the platform. The journey concludes with either renewal or exit from the subscription. Each stage is supported by key business capabilities:
- Discover Content: Enabled by Marketing Management to attract and inform potential customers.
- Evaluate Offering: Supported by Product Information Management, providing detailed content and subscription information.
- Subscribe: Managed through Subscription Management systems for seamless onboarding.
- Access Content: Secured by Identity and Access Management to ensure authorized usage.
- Consume Content: Delivered via robust Content Delivery mechanisms for optimal user experience.
- Engage & Retain: Enhanced through Customer Engagement initiatives to build loyalty.
- Renew or Exit: Facilitated by Billing and Lifecycle Management, handling renewals and cancellations efficiently.
This structured approach ensures a smooth and engaging experience for customers throughout their digital content journey.
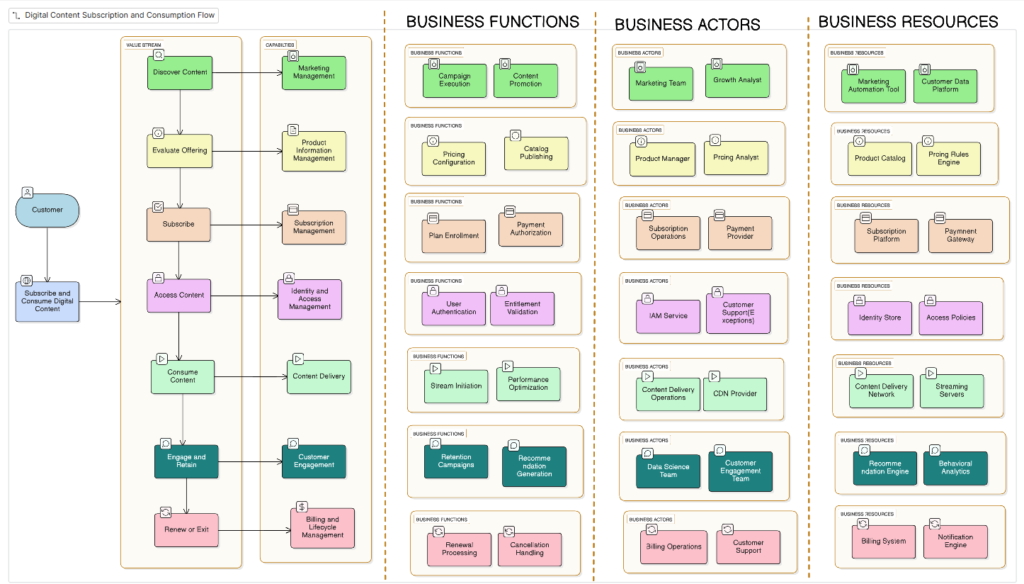
As similar to earlier pattern, In the diagram below, the Value Stream Stages are mapped to corresponding Capability and related Business Functions, Business Actors and Business Resources
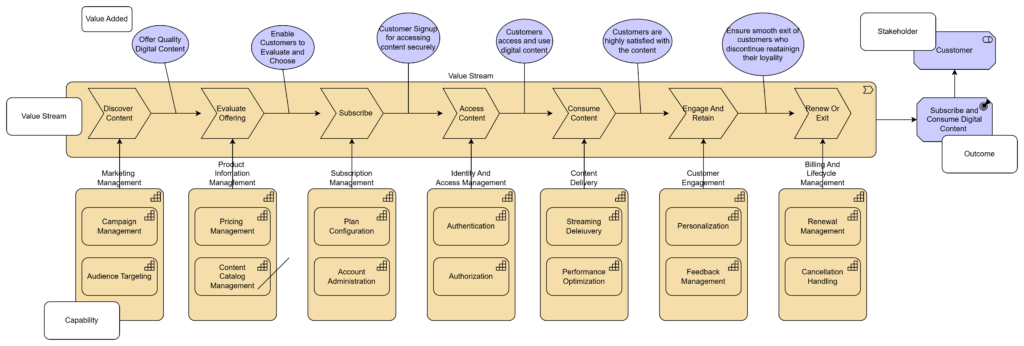
We can use Archimate to draw the above block diagram as shown below. ArchiMate uses specific symbols to denote value stream, Capability and elements. The diagram depicts Value Stream, Capability, Values added, the Stakeholder and the Business Outcome.
Big Picture: How These Elements Fit Together
| Element | Answers | Example |
|---|---|---|
| Value Stream | Why value is delivered | Subscribe & Consume Digital Content |
| Capability | What the business can do | Subscription Management |
| Business Function | How work is performed | Plan Provisioning |
| Business Actor | Who performs the work | Subscription Operations Team |
| Resource | What is used | CRM, CMS, Content Library |
Capability Analysis
While exploring, mapping and studying, we would come across varying degrees of capabilities based on factors such as what they can deliver, how best they can deliver, how adaptable they are and how they perform. We would also come across that some of the capabilities are obsolete and there are capabilities that are non-existent due to which the organization is unable to deliver value. Capabilities are expected to deliver the goals of the organization, and they may fall short of the desired level. Following tables summarizes the various approaches available for analysis
| Approach | Description | Objective | Use Case | Effort | Complexity | Output | Audience |
|---|---|---|---|---|---|---|---|
| Heat Map | Visual prioritization matrix | What’s the priority? | Quick portfolio view | Low | Low | Visual prioritization | Executives |
| Maturity Model | Level-based improvement (CMMI, COBIT) | How good are we? | Structured improvement | Medium | Medium | Level ratings & roadmap | Management |
| Balanced Scorecard | Multidimensional view (Financial, Customer, Process, Learning) | Are we balanced? | Holistic assessment | Medium | Medium | Multidimensional scores | Executives |
| Value Stream | Lean analysis, waste elimination | Where’s the waste? | Process optimization | Medium | Medium | Process maps & waste | Operations |
| Benchmarking | Comparison against peers/best-in-class | How do we compare? | Performance comparison | High | Medium | Gap analysis | Management |
| Gap Analysis | Current vs. Target state comparison | What needs fixing? | Transformation planning | High | High | Detailed gaps & roadmap | All levels |
| Risk-Based | Prioritization by risk exposure | What’s dangerous? | Risk-driven prioritization | Medium | Medium | Risk register | Executives |
| SWOT | Strengths, Weaknesses, Opportunities, Threats | What’s our position? | Strategic positioning | Low | Low | Strategy options | Executives |
| TCO | Total Cost of Ownership financial focus | What’s the cost? | Cost optimization | Medium | Medium | Financial business case | Finance |
| Dependency | Understanding capability interdependencies | What depends on what? | Sequencing & impact | High | High | Network diagram | Architects |
| People, Process , Technology | Balanced people/process/tech | Did we cover everything? | Transformation Program | Medium | Medium | Balanced improvement plan | All levels |
While each of this could be a subject for a blog itself, we will discuss Heat Map Analysis which are very common and low effort analysis
Capability Heat Map Analysis
Following is a fictious example of analysis of 9 capabilties Customer Onboarding,Data Management,Payment Processing,Fraud Detection,Mobile App,CRM System,Cybersecurity,Call Center Operations and Legacy Reporting
The evaluation was done on following scoring
Scale: 1-5 for each dimension
- 1 = Critical/Poor/Very Low
- 2 = Below Target/Weak/Low
- 3 = Adequate/Fair/Medium
- 4 = Good/Strong/High
- 5 = Excellent/Best-in-class/Very High
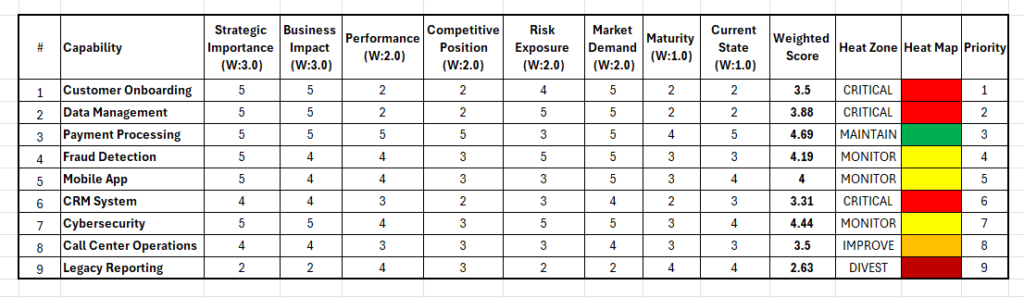
Each capability was evaluated on 8 dimesnions of Strategic Importance,Business Impact,Performance,Competitive Position,Risk Exposure,Market Demand,Maturity and Current State. The dimesnions were given a weightage with toatl weightage score of 100% as given below
Selected Dimensions with Round Figure Weights
| Dimension | Weight | Rationale | % of Total |
|---|---|---|---|
| Strategic Importance | 3.0 | Alignment with business strategy – highest priority | 18.75% |
| Business Impact | 3.0 | Direct effect on revenue/operations – highest priority | 18.75% |
| Performance | 2.0 | Current effectiveness – critical operational metric | 12.50% |
| Competitive Position | 2.0 | Market standing – external benchmark | 12.50% |
| Risk Exposure | 2.0 | Threat level – downside protection | 12.50% |
| Market Demand | 2.0 | External pressure – customer/regulatory requirements | 12.50% |
| Maturity | 1.0 | Process development – operational foundation | 6.25% |
| Current State | 1.0 | Overall health – holistic condition assessment | 6.25% |
| TOTAL | 16.0 | 100% |
Heat Zone Thresholds (Based on 1-5 Scale)
| Heat Zone | Score Range | Color | Count | Action Required |
|---|---|---|---|---|
| CRITICAL | < 3.50 | Red | 4 | Urgent transformation/action |
| IMPROVE | 3.50 – 3.99 | Orange | 1 | Systematic improvement needed |
| MONITOR | 4.00 – 4.49 | Yellow | 3 | Selective enhancement, monitor |
| MAINTAIN | ≥ 4.50 | Green | 1 | Protect and maintain excellence |
The Capability assessment data is as follows
Complete Capability Assessment Matrix (9 Capabilities × 8 Dimensions)
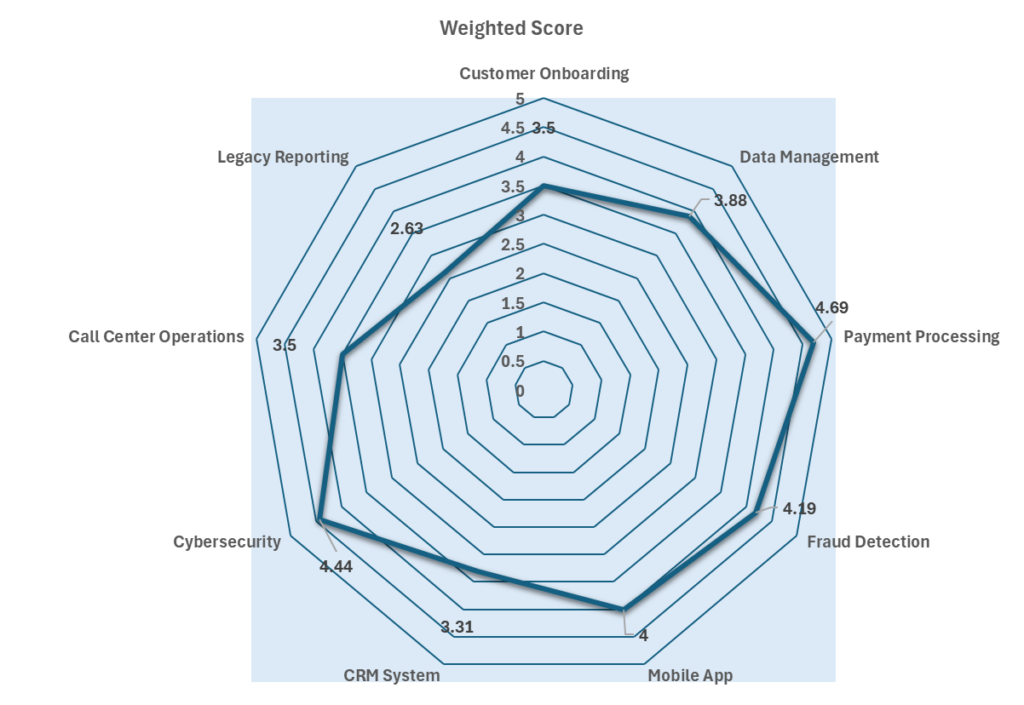
The heat map can also be shown in a radar chart as below showing the realtive rating
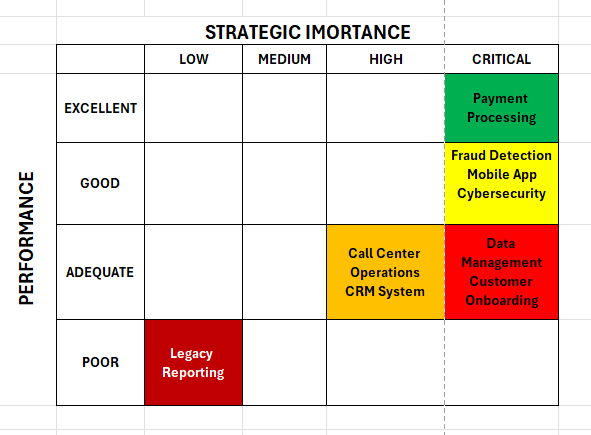
This is another heat map plotting Strategic Importance to Perfomance among various capabilties
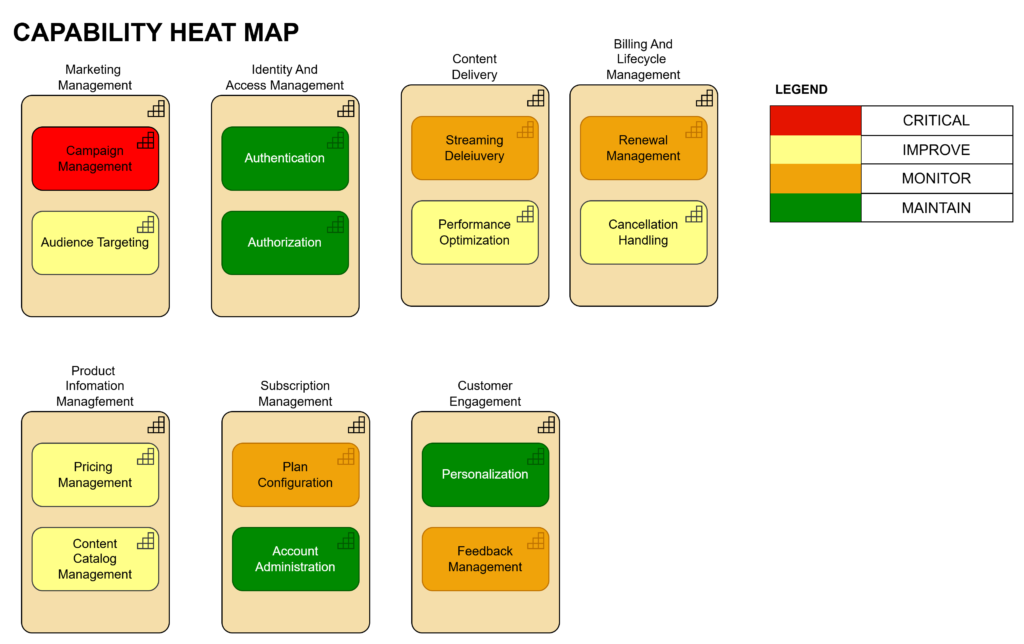
The heatmap can also be shown in a Capability diagram, for example for capabilties in the Digital Media Content example, we could represent the realtive capabilties as shown below
Conclusion
In this article we explored the Enterprise Architecture at a very high level, its various layers and alternate views and how the different aspects of the standard/model are interconnected. We discussed the relevance of this context with respect to Capability. We further looked at a Value Stream for a typical enterprise scenario and hoe capabilities fulfill the value stream. We also looked at how other elements of the Business Architecture are associated to capabilities. We mapped the Value Stream and Capabilities using the ArchiMate model. We also looked at the various methodologies used by the enterprise to analyze capability depending on the use case and desire outcome and other factors. We took a deep dive in the Capability Heat Map analysis and discussed in detail the methodology for rating and plotting the values on to heatmap and other charts. We also looked at how heatmap can be represented in the Capability Map
In the next part of this article we will explore a real life use case of evaluating a capability