
Introduction
The Application Rationalization and Modernization Blueprint provides a structured, fact-based approach to transforming the enterprise application landscape to better support current and future business needs. As organizations face increasing pressure to reduce technology cost, improve agility, strengthen security, and enable digital growth, legacy and redundant applications often become a significant barrier to progress. The objective of this article is to bring to focus the end-to-end activities involved in delivering it’s stated objective and highlight the depth and breadth of spread and involvement of various organizational units, functions and actors in delivering them
The activities involved covers a wide variety of concerns, contexts, data, resources, tools and decision criteria, the detailed discussion of which is simply impossible to cover. However, we will cover the salient aspects of the program and some of the activities which are more relevant from a technical and architectural perspective
Components of the Application Rationalization Program
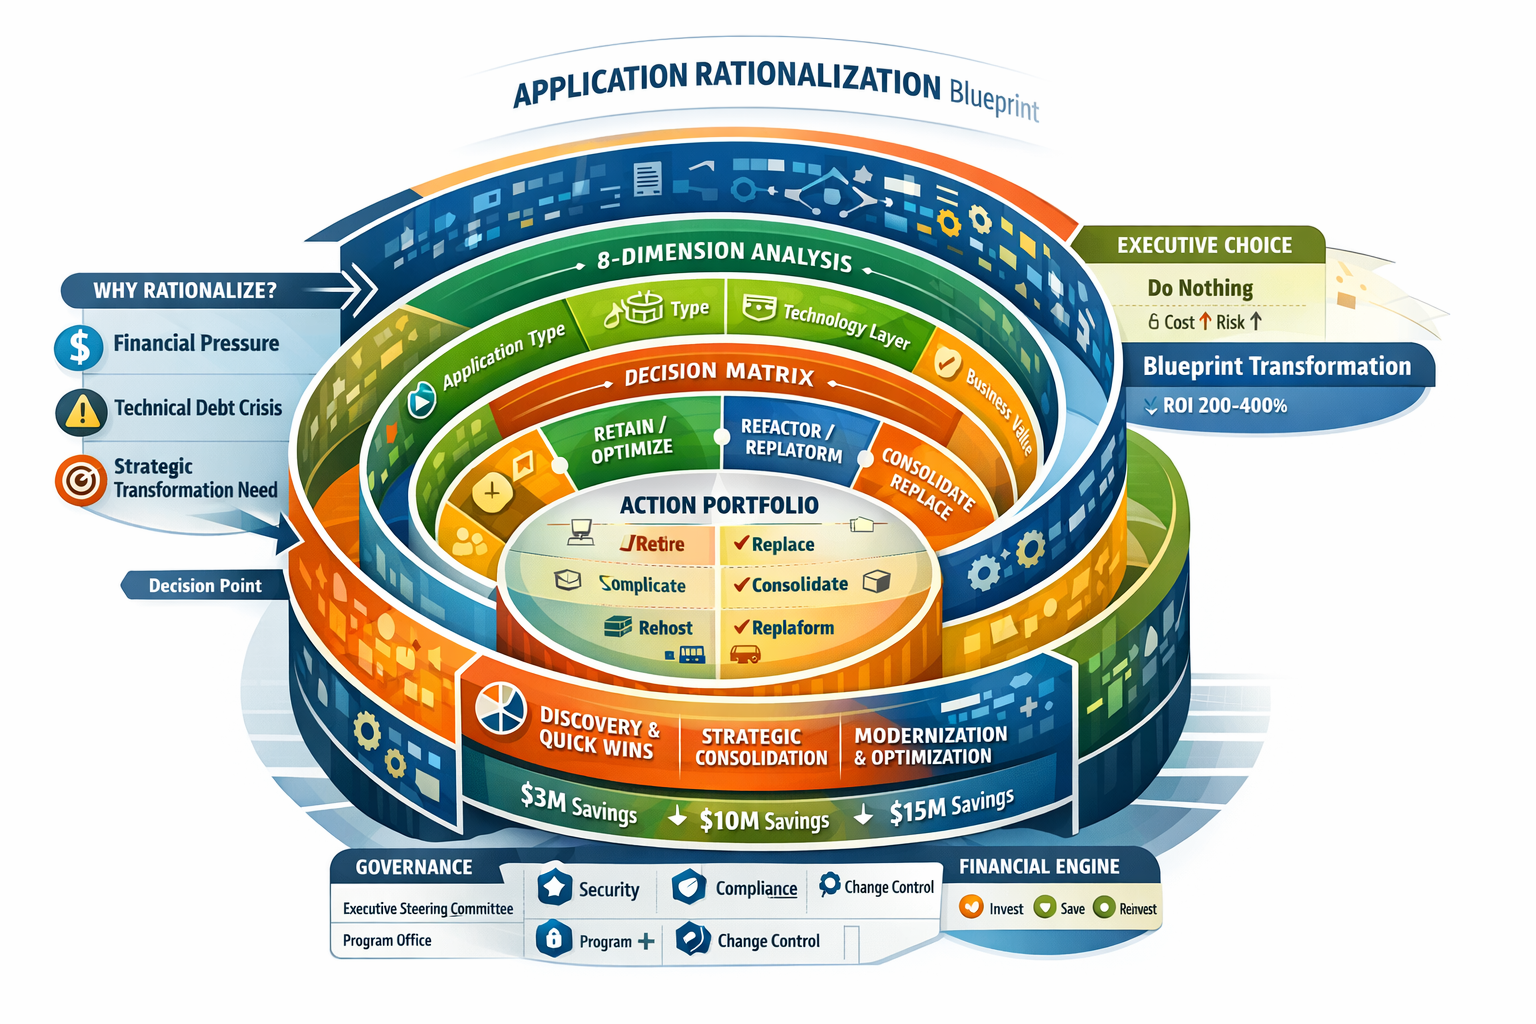
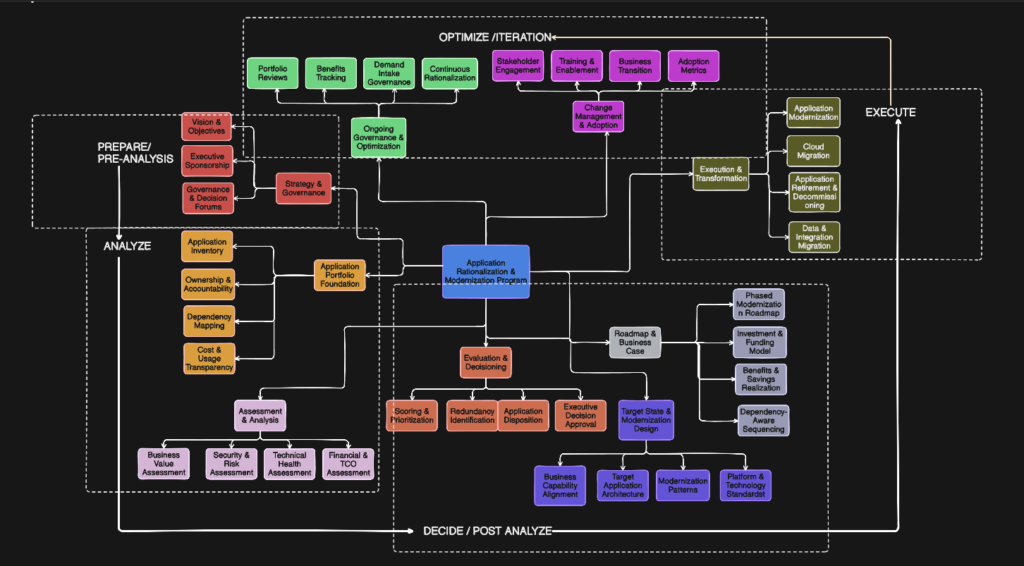
The Application Rationalization and Modernization Program is built on a strong governance and portfolio foundation. Applications are assessed across business, technical, security, and financial dimensions, objectively evaluated and dispositioned, modernized through a target-state architecture and roadmap, executed through disciplined transformation, and sustained through continuous governance and optimization. The following diagram gives an overview of various components
The components are also mapped to various life-cycle stage of the program covering
- Pre-Analysis (Set the Foundation) – Prepare the organization, establish authority, and ensure readiness before analysis begins. In this phase vision, scope, and success metrics are defined along with principles, policies and guidelines, executive sponsorship and governance is established and program structure and roles are stood up
- Analysis (Understand the Current State)-Build a fact-based understanding of the application landscape. In this phase, application inventory is discovered and validated, business, technical, security, and cost data are collected, redundancies and risks are identified and applications are scoped
- Post-Analysis (Decide the Future State) – Turn analysis into decisions and plans. Application dispositions are classified such as retain, retire, modernize, replace. Target state architecture and modernization patterns are defines and business case and roadmap are created
- Execution (Realize the Value) – Implement decisions and deliver outcomes. Applications are modernized, migrated and decommissioned. Infrastructure and licensing costs are reduced and business transition plans are executed
- Iteration (Sustain & Optimize) – Make rationalization continuous, not a one-time effort. Benefits and KPI are tracked, new applications are taken for modernization and iteration is continued
General Use Cases for Application Rationalization
An Application Rationalization program can be initiated for any number of reasons. Following are some of the popular use cases for adopting the program
Expand here
| # | Use Case | Description | Primary Drivers | Typical Outcomes |
|---|---|---|---|---|
| 1 | Cost Reduction & Run-Cost Optimization | Eliminate redundant, low-value, or underused applications to reduce licensing, infrastructure, and support costs | Rising IT spend, budget pressure | 10–30% application cost reduction |
| 2 | Application Portfolio Simplification | Reduce the total number of applications and overlapping capabilities | Portfolio sprawl, complexity | Smaller, easier-to-manage portfolio |
| 3 | Cloud Migration Readiness | Identify applications suitable for rehost, refactor, or replace before cloud migration | Cloud strategy, data center exit | Faster, lower-risk cloud adoption |
| 4 | Legacy System Retirement | Decommission end-of-life or unsupported applications | Vendor EOL, skill shortages | Reduced operational risk |
| 5 | Business Capability Alignment | Align applications to business capabilities and value streams | M&A, business transformation | Clear business-to-IT alignment |
| 6 | Redundancy & Overlap Elimination | Identify multiple systems serving the same function | Decentralized IT, M&A | Consolidated platforms |
| 7 | Security & Risk Reduction | Remove or modernize applications with security, compliance, or audit risks | Cyber risk, regulatory pressure | Improved security posture |
| 8 | Technology Standardization | Reduce technology diversity and improve standard adoption | High maintenance effort | Lower support complexity |
| 9 | Modernization & Digital Enablement | Identify apps that need modernization to support APIs, microservices, or digital channels | Digital transformation | Increased agility and scalability |
| 10 | License & Vendor Optimization | Rationalize vendor contracts and unused licenses | SaaS sprawl, rising subscription costs | Vendor consolidation, savings |
| 11 | M&A Integration | Rationalize overlapping portfolios post-merger | Duplicate systems, integration delays | Faster post-merger synergies |
| 12 | Data Center Exit / Infrastructure Reduction | Identify applications blocking infrastructure shutdown | DC exit strategy | Accelerated data center closure |
| 13 | Operational Resilience Improvement | Remove fragile or tightly coupled applications | Frequent outages | Improved stability |
| 14 | User Experience Improvement | Replace fragmented user journeys with integrated platforms | Poor adoption, shadow IT | Better user satisfaction |
| 15 | Regulatory & Compliance Alignment | Ensure applications meet regulatory, data residency, and audit requirements | New regulations | Reduced compliance exposure |
| 16 | DevOps & Delivery Acceleration | Remove legacy blockers to CI/CD and automation | Slow delivery cycles | Faster time-to-market |
| 17 | Portfolio Transparency & Governance | Establish visibility and ownership across the application estate | Lack of accountability | Ongoing portfolio discipline |
| 18 | IT Operating Model Transformation | Shift from project-centric to product-centric ownership | Agile / product model adoption | Clear product ownership |
| 19 | SaaS & Platform Adoption | Replace custom or on-prem apps with SaaS or shared platforms | High customization costs | Reduced technical debt |
| 20 | Continuous Portfolio Optimization | Embed rationalization into ongoing governance, not a one-time effort | Portfolio re-growth | Sustained benefits over time |
Organizational Units Involved in Application Rationalization
Application Rationalization is a company wide program. The program at the top level has the Executive Sponsorship and is a joint effort by multiple organizational units depending on the program objectives. Below is a comprehensive view of the organizational units involved in Application Rationalization and how each participates across the lifecycle.
Expand here
| # | Organizational Unit | Primary Role | Key Responsibilities in Rationalization | Typical Deliverables |
|---|---|---|---|---|
| 1 | Executive Leadership (CIO / CTO / CDO) | Strategic sponsorship & decision authority | Set vision and priorities, approve scope and funding, resolve conflicts, approve dispositions | Program charter, funding approval, final decisions |
| 2 | Business Units / Product Owners | Business value ownership | Define business criticality, usage, and value; validate impacts; own adoption | Business value scores, impact validation |
| 3 | Enterprise Architecture (EA) | Methodology & design authority | Define framework, evaluation criteria, target-state architecture, standards | Scoring model, target architecture, principles |
| 4 | Application Architecture & Engineering | Technical assessment & execution | Assess application health, dependencies, modernization options; execute changes | Technical assessments, migration plans |
| 5 | IT Operations / Infrastructure / Cloud | Runtime & platform expertise | Provide hosting data, operational risk input, support migration and decommissioning | Infra cost data, cloud readiness |
| 6 | Information Security & Risk | Security & compliance authority | Assess security posture, regulatory alignment, define gating criteria | Risk scores, compliance findings |
| 7 | Finance / FinOps / IT Financial Management | Cost transparency & ROI validation | Provide TCO data, savings estimates, business case validation | Cost models, ROI analysis |
| 8 | Procurement & Vendor Management | Commercial & vendor oversight | Manage contracts, license data, renewals, vendor consolidation | Contract analysis, vendor exit plans |
| 9 | Data, Integration & Analytics | Data & interface continuity | Assess data dependencies, plan migration, ensure reporting continuity | Data migration plans, integration maps |
| 10 | Change Management & Training | Adoption & readiness | Manage user impact, communications, training, adoption risks | Change plans, training materials |
| 11 | Program / Portfolio Management Office (PMO / EPMO) | Program orchestration & governance | Track progress, manage risks, coordinate cross-functional activities | Roadmaps, status reports |
| 12 | Legal & Compliance | Regulatory & contractual oversight | Review data residency, regulatory obligations, contract risks | Legal risk assessments |
| 13 | Audit & Internal Controls | Assurance & control validation | Validate compliance, control effectiveness, audit readiness | Audit findings, control reports |
| 14 | Service Management (ITSM) | Operational continuity | Ensure service continuity during changes, manage incidents | Service transition plans |
| 15 | External Partners / System Integrators | Specialized execution support | Provide tooling, accelerators, and delivery capacity | Assessments, migration execution |
Requirements for a Successful Application Rationalization Program
CRITITCAL Requirements – These are non-negotiable. Absence of any one typically results in stalled or failed programs.
Expand here
| # | Requirement | Description | Why Critical? |
|---|---|---|---|
| 1 | Strong Executive Sponsorship | Clear CIO / CTO mandate Authority to resolve cross-business conflicts Willingness to enforce decisions (retire, replace, consolidate) | Rationalization is political; authority is required. |
| 2 | Clear Objectives & Success Metrics | Explicit goals (cost reduction, risk reduction, cloud readiness) Measurable KPIs (apps retired, cost saved, risk reduced) Defined scope and boundaries | Prevents analysis paralysis and scope creep. |
| 3 | Single, Trusted Application Inventory | Central source of truth Clear ownership per application Regularly maintained | Decisions without accurate inventory are invalid. |
| 4 | Objective, Agreed Scoring Framework | Business, technical, security, and cost dimensions Weighted criteria Stakeholder buy-in | Removes opinion-based decision making. |
| 5 | Business Ownership & Accountability | Named business owners for each application Ownership of value and impact Accountability for adoption | IT cannot rationalize business applications alone. |
| 6 | Clear Disposition Rules | Standard categories (Retain, Retire, Replace, Modernize) Gating criteria (e.g., security non-compliance → retire) Consistent application across portfolio | Prevents endless debate and exceptions. |
HIGH (Strongly Recommended – Major Impact on Outcomes) -These significantly increase success rate and speed, but programs can start without them.
Expand here
| # | Requirement | Description | Why? |
|---|---|---|---|
| 1 | Enterprise Architecture Leadership | Defined principles and standards Target-state architecture Alignment to business capabilities | Avoids point optimizations and rework. |
| 2 | Financial Transparency (TCO & Savings) | Application-level run cost visibility License and infrastructure costs Savings tracking post-rationalization | Rationalization must prove economic value |
| 3 | Security & Risk Integration | Security posture assessments Compliance gating Risk-based prioritization | Reduces audit and cyber exposure. |
| 4 | Dependency & Integration Mapping | Application interdependencies Data and interface mapping Decommissioning readiness | Prevents business disruption. |
| 5 | Governance & Decision Forums | Defined decision bodies Escalation paths Regular cadence | Keeps momentum and resolves conflicts. |
| 6 | Change Management & Communication | Impact analysis Stakeholder communications Training and enablement | Adoption determines realized value. |
MEDIUM (Enablers – Improve Efficiency & Sustainability) – These improve scale, repeatability, and long-term sustainability.
Expand here
| # | Requirement | Description | Why? |
|---|---|---|---|
| 1 | Portfolio Management Tooling | Application portfolio management (APM) tools Automated scoring and reporting Integration with CMDB and finance tools | Reduces manual effort and improves accuracy. |
| 2 | Phased Roadmap & Quick Wins | Near-term retirements Long-term modernization waves Dependency-aware sequencing | Builds credibility and funding support. |
| 3 | Standard Modernization Patterns | Approved cloud and SaaS patterns Reuse of reference architectures Clear migration playbooks | Speeds execution and reduces risk |
| 4 | PMO / Program Discipline | Integrated planning and tracking Risk and issue management Benefit realization tracking | Keeps execution predictable. |
NICE-TO-HAVE (Optimization – Not Required to Start) – These enhance maturity but are not required initially.
Expand here
| # | Requirement | Description |
|---|---|---|
| 1 | Advanced Analytics & Dashboards | Heatmaps Scenario modeling What-if analysis |
| 2 | AI-Assisted Discovery & Scoring | Automated app discovery Pattern detection Predictive scoring |
| 3 | Continuous Rationalization Automation | Embedded into intake processes Automated lifecycle reviews |
| 4 | Industry Benchmarking | Peer comparisons Cost and complexity benchmarks |
Phases of an Application Rationalization Program
Following are the phases of the Application Rationalization Program in the order of execution. Phase may be combined or reduced depending on the scope, finance, time and other criteria
| # | Phase | Description | Purpose | Key Activities | Key Deliverables |
|---|---|---|---|---|---|
| 1 | Phase 1 | Strategy & Mobilization | Establish direction, authority, and structure. | Define business drivers and objectives Establish executive sponsorship and governance Define scope, principles, and success metrics Stand up program team and roles | Rationalization charter Objectives & KPIs Governance model Program plan |
| 2 | Phase 2 | Application Inventory & Discovery | Create a trusted, enterprise-wide application baseline. | Identify all applications (enterprise, departmental, shadow IT) Capture ownership, users, vendors, contracts Identify integrations and dependencies Validate inventory with business and IT | Application inventory (system of record) Dependency map Ownership assignment |
| 3 | Phase 3 | Data Collection & Assessment | Gather the facts needed for objective evaluation | Collect business value data (criticality, usage, capability alignment) Collect technical data (architecture, lifecycle, security posture) Capture cost and vendor data Identify regulatory and compliance requirements | Application fact sheets Business, technical, security, and cost profiles |
| 4 | Phase 4 | Evaluation & Scoring | Objectively compare applications across the portfolio. | Apply scoring framework and weights Conduct workshops to validate scores Identify redundancy and low-value applications Generate heatmaps and rankings | Scored application portfolio Risk/value heatmaps Redundancy analysis |
| 5 | Phase 5 | Disposition & Decision-Making | Decide the future of each application. | Classify applications (Retain, Retire, Replace, Modernize, Consolidate) Apply gating criteria (security, compliance, cost) Resolve conflicts and exceptions Secure executive approvals | Application disposition matrix Approved decision log |
| 6 | Phase 6 | Target-State Architecture & Modernization Design | Ensure coherent future-state, not isolated decisions. | Map applications to business capabilities Define target platforms (SaaS, PaaS, cloud-native) Define modernization patterns and standards Align with enterprise architecture principles | Target-state application architecture Reference architectures Technology standards |
| 7 | Phase 7 | Roadmap & Business Case Development | Turn decisions into an executable plan. | Prioritize initiatives based on value vs effort Sequence modernization waves Build financial business cases Align with budget and funding cycles | Rationalization & modernization roadmap Business case and ROI Investment plan |
| 8 | Phase 8 | Execution & Decommissioning | Realize value through action. | Execute modernization and migration initiatives Retire and decommission applications Migrate data and integrations Realize cost take-out | Modernized applications Decommissioned systems Infrastructure and license reductions |
| 9 | Phase 9 | Change Management & Adoption | Ensure business continuity and value realization. | Manage business and user impacts Deliver training and communications Support transition to new systems Address resistance and adoption risks | Change management plan Training materials Adoption metrics |
| 10 | Phase 10 | Governance, Measurement & Continuous Improvement | Sustain and scale the benefits. | Track KPIs and benefits realization Update application inventory continuously Embed rationalization into demand intake Review portfolio regularly | KPI dashboards Updated application portfolio Continuous improvement plan |
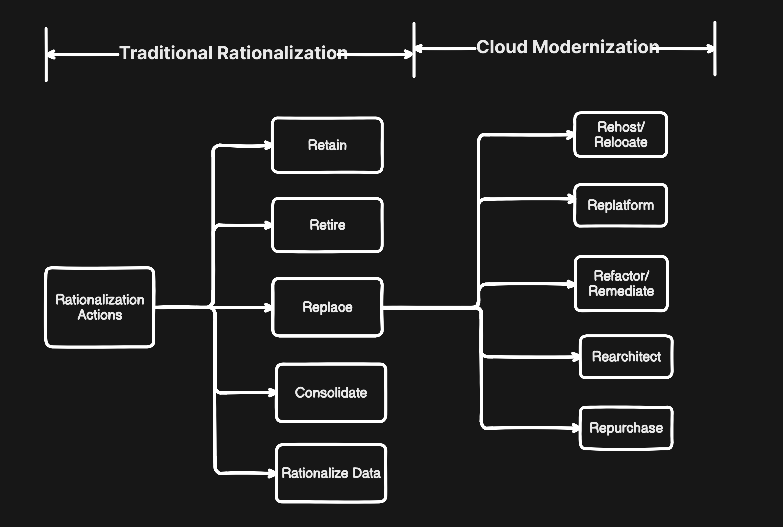
Rationalization Actions Matrix – Understand high level rationalization approaches
The Rationalization Recommendation falls into one of the following categories
| Action | Description | When to Apply | Typical Savings |
|---|---|---|---|
| Retain | Keep as-is | Strategic, healthy apps | 0% (baseline) |
| Retire | Decommission completely | Obsolete, unused apps | 100% of run cost |
| Replace | Swap with alternative | Legacy, high-maintenance apps | 30-70% cost reduction |
| Consolidate | Merge multiple apps | Redundant functionality | 50-80% cost reduction |
| Rationalize Data | Simplify data architecture | Data sprawl, redundancy | 40-60% storage reduction |
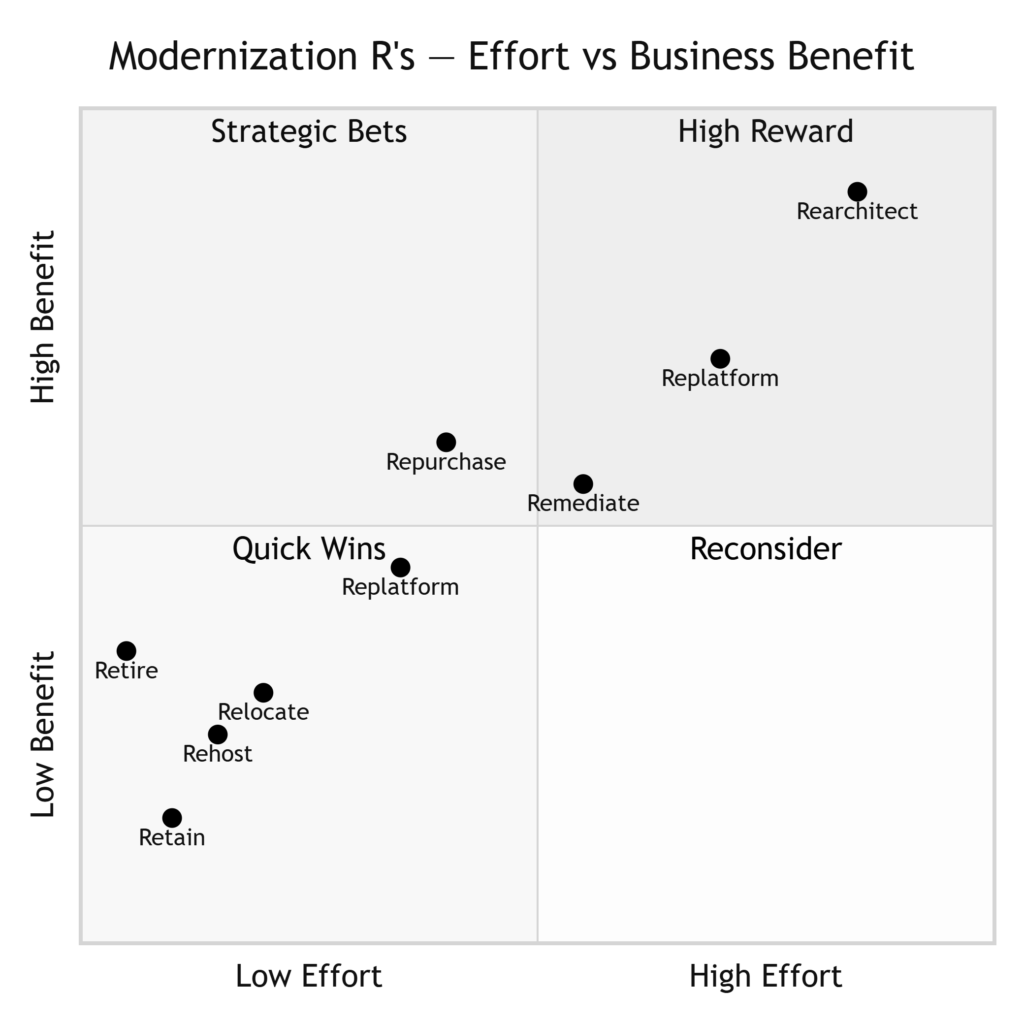
Further the Replace Action can fall into one of the following modernization paths
| Action | Description | When to Apply | Typical Savings |
|---|---|---|---|
| Rehost/Relocate | Lift and shift — move app to cloud as-is with no changes. Fastest, least benefit or Move infrastructure to cloud without purchasing new hardware — VMware on AWS for example | Speed is priority, large portfolio, budget constrained | 20–30% |
| Replatform | Lift, tinker and shift — minor optimizations like moving to managed database without changing core code | Want some cloud benefit without full rewrite. | 30–40% |
| Refactor/Remediate | Redesign the application making suitable changes to accommodate hosting in the cloud like logging, configuration etc. Or Fix security, compliance or technical debt issues before or during migration | App is strategic, needs scale, agility, or cloud native features | 40–70% |
| Rearchitect | Entirely build the functionality from scratch | The Application is strategic and long term use. Run it a on a modern stack instead of legacy | 20–40% |
| Repurchase | Drop and shop — replace with a SaaS product e.g. move CRM to Salesforce | Commercial SaaS does it better and cheaper | 20–40% |
Financing Strategies for Application Rationalization Programs
Application rationalization programs typically cost $500K to $10M+ depending on portfolio size and complexity. These multi-year initiatives require creative financing approaches beyond traditional IT budgets. Here are the comprehensive financing options available.
TRADITIONAL INTERNAL FUNDING
Traditional internal funding draws from existing organizational budgets — either as annual IT operating allocations spread across three to four years, one-time capital budget requests requiring board approval, or allocations from a corporate-level IT transformation fund. These approaches rely entirely on internal financial resources without external dependencies. Annual operating budgets suit smaller portfolios with incremental timelines, while CapEx funding enables aggressive, time-bounded programs for large portfolios. Transformation funds provide milestone-gated releases with executive visibility. Common to all three is predictability and control, though each carries trade-offs between speed, approval complexity, and competition with other organizational priorities for limited available funding.
Expand here
| FUNDING METHOD | Mechanics | Pros and Cons | Best For | Examples |
|---|---|---|---|---|
| Annual IT Operating Budget Fund from existing IT operational budgets over multiple years | Year 1: $500K (planning, assessment, quick wins) Year 2: $1.5M (major migrations, decommissions) Year 3: $1M (remaining migrations, optimization) Year 4: $500K (stabilization, documentation) Total: $3.5M over 4 years | Pros: No special approvals needed (within budget authority) Spreads cost over time Predictable, controlled spending No external dependencies Cons: Competes with other IT priorities Slow progress (limited annual funding) May not achieve critical mass for momentum Risk of funding cuts mid-program | Small portfolios (<100 applications) Mature organizations with stable IT budgets Non-urgent rationalization needs Incremental approach acceptable | Portfolio: 150 applications, $8M annual IT run cost Annual IT budget: $25M Rationalization allocation: $750K/year (3% of budget) Timeline: 3-4 years Expected savings: $2M/year (25% reduction in run cost) Payback: 18 months after completion |
| Capital Budget / Capex Funding Secure one-time capital funding for the program | Capital Request: $5M Justification: IT modernization initiative Approval: Board/C-suite required Timeline: Single fiscal year or multi-year Capex plan Accounting Treatment: Infrastructure investments capitalized over 3-5 years Software licenses capitalized Professional services typically expensed Cloud migration may be Opex (check accounting standards) | Pros: Large upfront funding enables rapid progress Dedicated budget (protected from operational cuts) Creates sense of urgency and accountability Can fund aggressive timeline Cons: Requires executive/board approval High upfront justification burden Difficult to adjust scope mid-program Failure highly visible | Large portfolios (>200 applications) Strategic transformation initiatives Organizations with available capital When speed is critical | Request: $8M capital investment Portfolio: 400 applications Timeline: 24 months Expected outcomes: – Decommission 150 apps (40% reduction) – Migrate 100 to cloud – Consolidate 50 to shared platforms Annual run cost savings: $5M Payback period: 19 months IRR: 35% |
| IT Transformation Fund Corporate-level transformation fund allocated to strategic initiatives | Transformation Fund: $50M (company-wide) Application Rationalization: Apply for $6M allocation Approval: Transformation steering committee Release: Milestone-based tranches Governance: Quarterly business case reviews Stage-gate funding releases ROI tracking and reporting Portfolio management office oversight | Pros: Purpose-built for transformation Executive visibility and support Milestone-based funding reduces risk Often includes change management support Cons: Competitive (multiple initiatives vying for funds) Heavy governance and reporting requirements Must demonstrate progress to continue funding May require returning unused funds | Organizations with formal transformation programs Medium to large portfolios When governance and oversight are strengths Part of broader digital transformation |
SELF-FUNDED / BOOTSTRAPPED APPROACHES
Self-funded approaches generate rationalization capital from within the program itself, requiring little or no upfront budget commitment. Quick win reinvestment starts by decommissioning the easiest applications first, then recycling those savings to fund progressively larger phases — achieving net-zero investment over time. Chargeback reallocation redirects a portion of what business units already pay for IT back into a centralized rationalization fund, aligning their incentives with program success. Vendor consolidation negotiates fragmented supplier contracts down to fewer strategic relationships, redirecting the savings gap into program financing. All three approaches are low-risk, self-sustaining, and particularly effective in organizations with tight budgets or high existing technical debt.
Expand here
| FUNDING METHOD | Mechanics | Pros and Cons | Best For |
|---|---|---|---|
| Reinvestment of Quick Win Savings Fund program from savings realized by early decommissions | Phase 1 (Self-funded from IT budget): $200K Decommission 10 “easy” apps Annual savings: $500K Timeline: 3 months Phase 2 (Funded by Phase 1 savings): $800K Decommission 30 more apps Additional savings: $1.5M Timeline: 6 months Phase 3 (Funded by accumulated savings): $2M Major migrations and consolidations Additional savings: $3M Timeline: 12 months Total Program Cost: $3M Total Annual Savings: $5M Net Investment: $0 (self-funded) | Pros: No upfront budget required Proves value before requesting major funding Low risk (can stop if savings don’t materialize) Builds momentum and credibility Cons: Slow start (limited initial funding) Requires discipline to reinvest savings May not work if easy wins are limited Finance may reclaim savings before reinvestment | Organizations with tight budgets Proving concept before major investment High technical debt portfolios (many easy wins) Risk-averse cultures |
| Chargeback Reallocation Redirect application costs from business units back to rationalization | Current State: Business Unit A pays: $2M/year for 50 apps Business Unit B pays: $1.5M/year for 40 apps Total IT chargeback: $3.5M/year Rationalization Funding Model: Year 1: BUs contribute 10% ($350K) to rationalization fund Year 2: BUs contribute 15% ($525K) to rationalization fund Year 3: BUs contribute 20% ($700K) to rationalization fund Post-Rationalization: BU A pays: $1.2M/year (40% reduction) BU B pays: $900K/year (40% reduction) Total chargeback: $2.1M/year BU savings: $1.4M/year ongoing | Pros: Business units fund and benefit directly Aligns incentives (BUs want rationalization) No new corporate funding required Creates shared accountability Cons: Requires mature chargeback model BUs may resist temporary cost increase Complex allocation formulas Difficult if some BUs don’t benefit equally | Organizations with established IT chargebacks Decentralized IT funding models When business units control budgets Portfolios with clear BU ownership |
| Vendor Consolidation Savings Renegotiate vendor contracts and redirect savings to rationalization | Current Vendor Spend: Vendor A (50 licenses): $500K/year Vendor B (30 licenses): $300K/year Vendor C (20 licenses): $200K/year Total: $1M/year Post-Rationalization: Consolidate to Vendor A: 60 licenses at $450K/year Savings: $550K/year Year 1-2: Redirect $550K to fund rationalization program Year 3+: Return $550K to business as permanent savings Typical Consolidation Opportunities: Multiple CRM systems → Single platform Fragmented monitoring tools → Unified observability Diverse databases → Standardized DB platform Various collaboration tools → M365/Google Workspace | Pros: Generates immediate funding source Simplifies vendor management Often easier to get approval (cost-neutral) Reduces ongoing license complexity Cons: Vendor lock-in risk May require multi-year commitments Transition costs can be significant User disruption and retraining | Fragmented vendor landscapes Organizations overpaying for licenses When standardization is a goal Strong vendor negotiation capability |
EXTERNAL FINANCING
External financing leverages third-party capital, incentives, or risk-sharing arrangements to fund rationalization without depleting internal budgets. Cloud provider credit programs — AWS MAP, Azure AMP, Google Accelerate — can contribute up to 25% of migration commitments as credits, services, and partner funding. System integrators offer gainshare or performance-based financing where they invest upfront and recover costs only from validated savings, aligning their incentives with outcomes. Technology refresh financing bundles rationalization costs within hardware lease agreements from Dell, HPE, or Cisco. Software vendor financing has target platform vendors subsidize migration through waived licensing, bundled implementation services, and extended payment terms in exchange for long-term contractual commitments.
Expand here
| FUNDING METHOD | Mechanics | Pros and Cons | Best For | Examples |
|---|---|---|---|---|
| Cloud Provider Credits / Incentives Leverage migration credits from AWS, Azure, Google Cloud | Cloud Migration Commitment: $10M over 3 years Provider Incentives Package: Migration credits: $1.5M (15% of commitment) Professional services: $500K Training credits: $200K Partner funding: $300K Total value: $2.5M Use of Credits: Fund migration tooling and automation Pay for third-party migration partners Cover dual-running costs (on-prem + cloud) Training and certification for staff Provider-Specific Programs: AWS: Migration Acceleration Program (MAP): Up to 25% of commitment Optimization and Licensing Assessment (OLA): Free assessment Well-Architected reviews: Free consulting Microsoft Azure: Azure Migration Program (AMP): Up to 20% of commitment FastTrack: Free deployment assistance Azure Hybrid Benefit: License discounts Google Cloud: Accelerate: Migration credits Cloud Adoption Framework: Free consulting Committed use discounts: Up to 55% savings | Pros: “Free money” reduces program cost Access to cloud provider expertise Accelerates cloud migration timeline Training included improves capability Cons: Requires cloud commitment (lock-in) Credits expire (12-24 month use-it-or-lose-it) May push suboptimal cloud migrations Often tied to specific partners | Cloud-first strategies Large migration programs Organizations new to cloud When cloud ROI is already proven | Company: 300-app portfolio, 60% on-premises Strategy: Migrate 120 apps to Azure (40% of portfolio) Azure commitment: $8M over 3 years Azure incentives: – AMP credits: $1.2M (15%) – FastTrack support: $400K value – Partner co-funding: $300K Total: $1.9M Use of incentives: – Migration tooling (CloudEndure, Movere): $300K – SI partner (Accenture, Deloitte): $800K – Dual-running period costs: $500K – Staff training/certification: $300K Net program cost reduction: $1.9M (48% of external costs) |
| System Integrator (SI) Financing SI partner provides upfront funding, repaid from savings | SI Financing Agreement: SI investment: $3M upfront Program duration: 18 months Repayment: 40% of realized savings for 3 years Risk sharing: SI only paid if savings achieved Example: Year 1: $4M savings realized → SI receives $1.6M Year 2: $4M savings realized → SI receives $1.6M Year 3: $4M savings realized → SI receives $1.6M Total SI return: $4.8M (60% ROI) Company keeps: $7.2M (60% of savings) Common Structures: 1. Gainshare Model: SI funds program costs Paid % of validated savings Typically 30-50% over 2-4 years Independent audit verifies savings 2. Performance-Based: Fixed fees contingent on outcomes Decommission X apps = $Y payment Achieve Z% cost reduction = bonus Penalties for missing targets 3. Managed Services Wrapper: SI takes over app portfolio management Commits to rationalization roadmap Paid fixed fee but guarantees savings Multi-year contract (5-7 years) | Pros: Zero upfront capital required SI shares risk (aligned incentives) Access to SI expertise and tools Only pay if value delivered Cons: Expensive over time (SI premium for risk) Complex savings validation disputes Loss of direct control SI may optimize for their payout, not best outcome | Best For: No available capital High confidence in savings potential Lack of internal expertise Risk-averse organizations | |
| Technology Refresh Financing Bundle rationalization with hardware/infrastructure refresh | Data Center Refresh Program: $12M New servers/storage: $6M Network upgrades: $2M Application rationalization: $3M Cloud migration: $1M Financing: Vendor lease (Dell, HPE): 3-year term Monthly payment: $370K Includes rationalization costs bundled in Leasing Options: 1. Capital Lease: Treated as owned asset Depreciate over useful life Lower monthly payments Own equipment at end 2. Operating Lease: Treated as rental expense Off-balance sheet financing Higher monthly payments Return equipment at end 3. Technology Refresh Programs: Dell Financial Services HPE Financial Services Cisco Capital Bundle hardware + services + software | Pros: Spreads cost over time (OpEx treatment) Easier to get approval (tied to necessary refresh) Predictable monthly payments Tax benefits (depending on structure) Cons: More expensive than upfront purchase Long-term commitment (3-5 years) May include unnecessary hardware Rationalization tied to refresh timeline | Organizations needing infrastructure refresh OpEx budget available (not CapEx) Prefer predictable monthly costs Tax optimization strategies | |
| Software Vendor Financing New platform vendor finances migration from legacy systems | Example: Migrate from 5 legacy CRM systems to Salesforce Salesforce Financing Offer: Waive Year 1 license fees: $800K savings Free migration services: $400K value Training credits: $100K Extended payment terms: 24 months vs 12 months Total subsidy: $1.3M In return: 5-year contract commitment Minimum seat count guarantee Reference customer agreement Common Vendor Incentives: SaaS Platforms: First year free/discounted Migration services included Dedicated success manager Extended payment terms Enterprise Software: Trade-in credits for legacy licenses Upgrade discounts (50-70% off) Professional services bundled Maintenance holiday (skip 1 year) | Pros: Reduces or eliminates upfront costs Vendor motivated to ensure success Access to vendor migration expertise Faster time to value Cons: Locks into vendor platform Favorable pricing may expire after commitment Hidden costs after honeymoon period Vendor optimizes for their product, not best fit | Clear target state platform identified Vendor has strong migration track record Multi-system consolidation scenarios When speed to deployment is critical | Scenario: Consolidate 3 HR systems to Workday Workday Proposal: – Waive $500K Year 1 subscription – Include $800K implementation services – 3-year contract at locked-in pricing – Total value: $1.3M Company investment: – Data migration: $300K – Change management: $200K – Customization: $100K Total: $600K Net program cost: $600K (vs $2.2M without vendor subsidy) Annual savings from retiring 3 systems: $1.2M Payback: 6 months |
INTERNAL CREATIVE FINANCING
Internal creative financing uncovers hidden or underutilized financial capacity already existing within the organization. Shadow IT recovery uses SaaS discovery tools to identify and eliminate unauthorized subscriptions, redundant cloud accounts, and forgotten licenses — often recovering $1.5–2 million annually from previously invisible waste. Shift left reallocation stops funding new development on legacy systems and redirects those budgets toward rationalization instead. Depreciation arbitrage monetizes fully depreciated but still-valuable hardware and software assets through secondary market sales or vendor trade-ins, generating balance sheet gains that fund the program. Procurement optimization renegotiates all vendor contracts simultaneously, redirecting 50% of achieved savings into the rationalization fund while returning the remainder to the business.
Expand here
| FUNDING METHOD | Mechanics | Pros and Cons | Best For |
|---|---|---|---|
| Shadow IT Recovery Identify and eliminate unauthorized spending to fund rationalization | Shadow IT Discovery: Unapproved SaaS subscriptions: $800K/year Redundant cloud accounts: $400K/year Forgotten licenses: $300K/year Duplicate tools: $500K/year Total shadow spend: $2M/year Approach: 1. Run SaaS discovery tools (Zylo, Torii, Productiv) 2. Identify unauthorized/redundant spend 3. Cancel or consolidate 4. Redirect savings to rationalization program Funding Generated: Year 1: $1.5M (75% of shadow spend eliminated) Year 2: $1.8M (90% eliminated) Year 3: $2M (full elimination) Discovery Tools: SaaS Management: Zylo, Torii, Productiv, BetterCloud Cloud Cost: CloudHealth, Cloudability, Apptio License Optimization: Flexera, Snow Software | Pros: Eliminates wasteful spending Improves security (unauthorized tools removed) Self-funding (no new budget required) Quick wins (can implement in weeks) Cons: Political resistance (people like their tools) May impact productivity short-term Requires ongoing governance Savings may be one-time | Organizations with poor SaaS governance Rapid growth companies (likely shadow IT) When security is a concern Immediate funding needed |
| Shift Left / Agile Reallocation Redirect planned development budgets to rationalization | Current Development Pipeline: Project A: $800K (new features for legacy app) Project B: $600K (integration between 2 systems) Project C: $400K (custom reporting for old system) Total: $1.8M Rationalization Decision: – Decommission legacy apps (Projects A & C obsolete) – Consolidate systems (Project B unnecessary) – Redirect $1.8M to rationalization program New Allocation: – Rationalization: $1.8M – Develop features on modern platform: $400K Net savings: $1.4M (redirected to further rationalization) Agile Portfolio Rebalancing: Before: 70% features on legacy apps 20% maintenance/tech debt 10% innovation After: 30% features (on modern platforms) 50% rationalization/migration 20% innovation Freed budget: 40% of development spend | Pros: Stops “throwing good money after bad” Accelerates rationalization Improves development velocity long-term No new funding required Cons: Business expectations management (delayed features) Development team disruption May slow short-term delivery Requires strong product leadership | High tech debt portfolios When development is maintaining legacy Organizations with agile budgeting Strong product management capability |
| Depreciation Arbitrage Leverage fully depreciated assets to fund rationalization | Fully Depreciated Assets: Data center equipment (original cost $5M): Book value $0 Legacy software licenses (original cost $2M): Book value $0 Current market value: $1.5M (secondary market) Strategy: 1. Sell/trade-in depreciated assets: Receive $1.5M 2. Accounting impact: $1.5M gain (no book value) 3. Reinvest in rationalization: $1.5M program funding 4. Result: “Free” funding from balance sheet optimization Asset Monetization Options: Hardware: Sell to secondary market (Iron Mountain, ITRenew) Trade-in to vendors (Dell, HPE, Cisco) Donate for tax deduction Software: Sell excess licenses (Software Resale, Relicensing) Renegotiate with vendor (credits for new purchases) Donate to nonprofits (tax benefit) | Pros: Generates cash from idle assets Cleans up balance sheet P&L gain improves financials Environmental benefit (proper disposal) Cons: Limited to depreciated assets May trigger tax liability Time-consuming to execute Secondary market pricing uncertain | Organizations with old infrastructure Assets fully depreciated but still valuable Finance-driven cultures When CFO support is critical |
| Procurement Optimization Renegotiate all vendor contracts and redirect savings | Current Annual Vendor Spend: $15M Software licenses: $8M Maintenance/support: $4M Hosted services: $2M Professional services: $1M Procurement Initiative: Renegotiate all contracts (10-25% savings) Benchmark pricing against market Consolidate vendors (volume discounts) Remove shelf ware (unused licenses) Year 1 Savings Achieved: Software licenses: $1.2M (15% reduction) Maintenance: $800K (20% reduction) Hosted services: $400K (20% reduction) Prof services: $200K (20% reduction) Total savings: $2.6M Allocation: – 50% to rationalization fund: $1.3M – 50% to bottom line: $1.3M Procurement Strategies: 1. Benchmark Pricing: Use Gartner, Forrester pricing databases Industry peer comparisons Competitive bidding 2. License Harvesting: Identify unused licenses (SAM tools) Reclaim and reallocate Downgrade unnecessary tiers 3. Contract Restructuring: Move from perpetual to subscription Cloud migration discounts Multi-year commitments for discounts 4. Vendor Consolidation: Preferred vendor programs Volume discount tiers Strategic partnerships | Pros: Ongoing savings (permanent cost reduction) CFO loves this (clear ROI) Professionalizes procurement Can execute quickly (3-6 months) Cons: Requires skilled negotiators Vendor relationships may suffer Time-consuming (many contracts) Savings may be one-time | Organizations with poor procurement discipline Many vendor relationships Overpaying for licenses Finance-led initiatives |
HYBRID / BLENDED FINANCING
The hybrid approach combines multiple funding sources to assemble a complete program budget while minimizing cash outlay and risk concentration. A typical $5 million program might draw 40% from the IT operating budget, 25% from cloud provider migration credits, 20% from vendor consolidation savings, 10% from shadow IT recovery, and 5% from business unit chargeback contributions. This blended model means only 45% of total program cost requires actual cash expenditure — the remainder is funded through savings, credits, and redirected waste. Blended financing is the most resilient structure, reducing dependency on any single approval or source while distributing accountability across IT, finance, and business stakeholders simultaneously.
Example: Application Rationalization Program: $5M total. Total Funding: $5M. Cash outlay: $2.25M (45% of total). Funded by savings/credits: $2.75M (55%)
| IT Operating Budget (40%): $2M | Cloud Provider Credits (25%): $1.25M | Vendor Consolidation Savings (20%): $1M | Shadow IT Recovery (10%): $500K | Chargeback Contribution (5%): $250K |
| Spread over 2 years from annual budget | AWS MAP credits for migration commitment | Oracle/SAP license reduction | Eliminate unauthorized SaaS | Business unit co-funding |
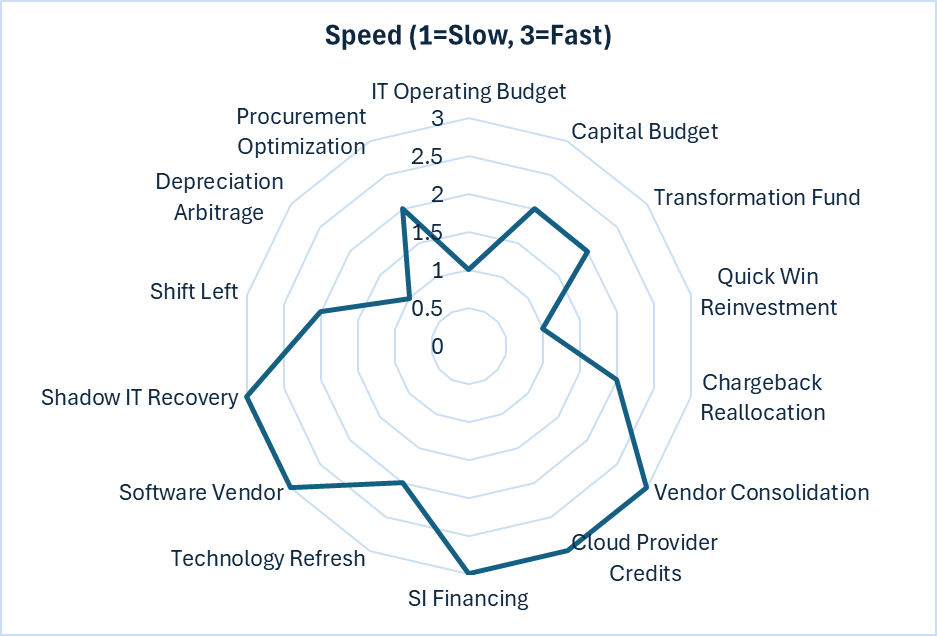
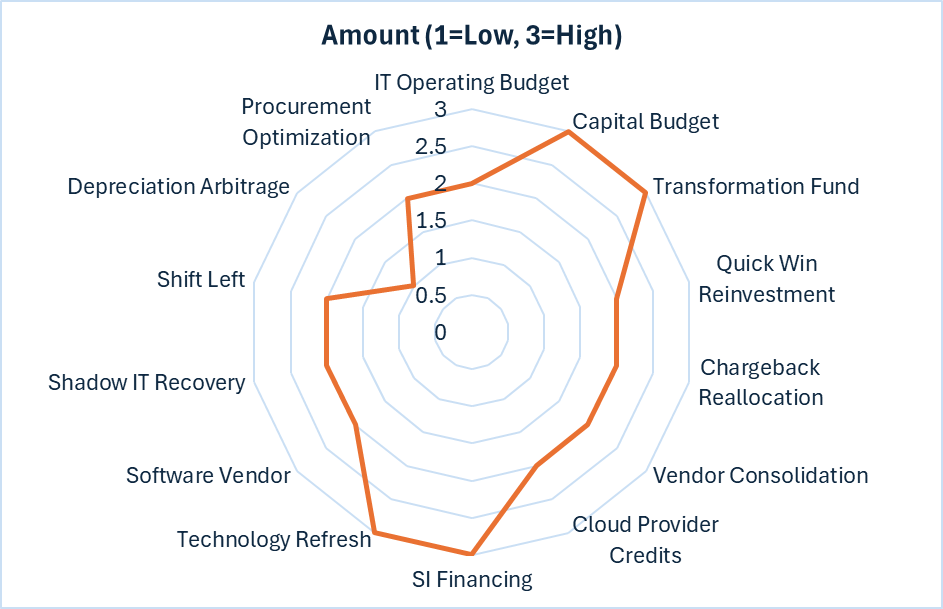
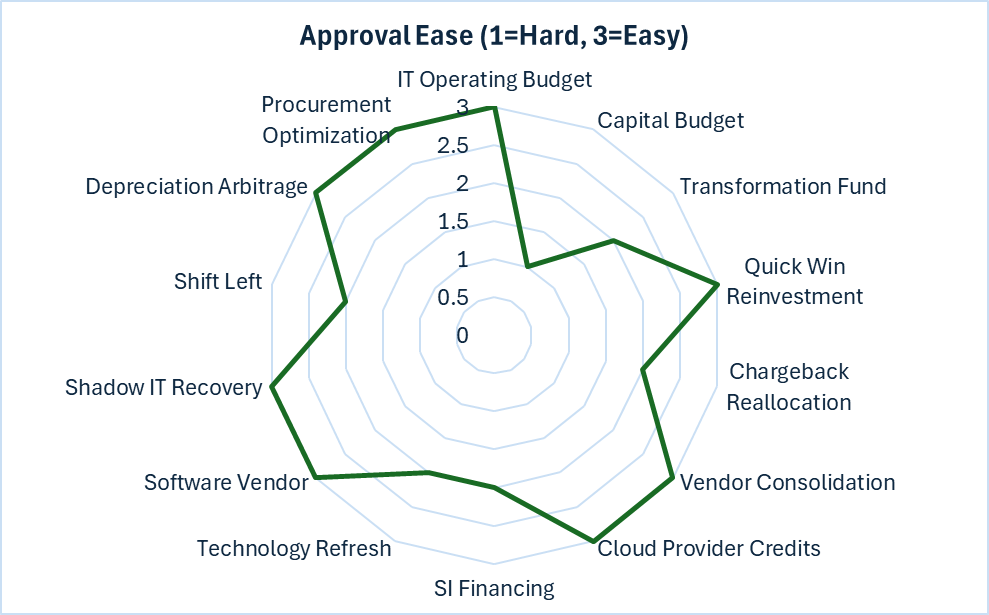
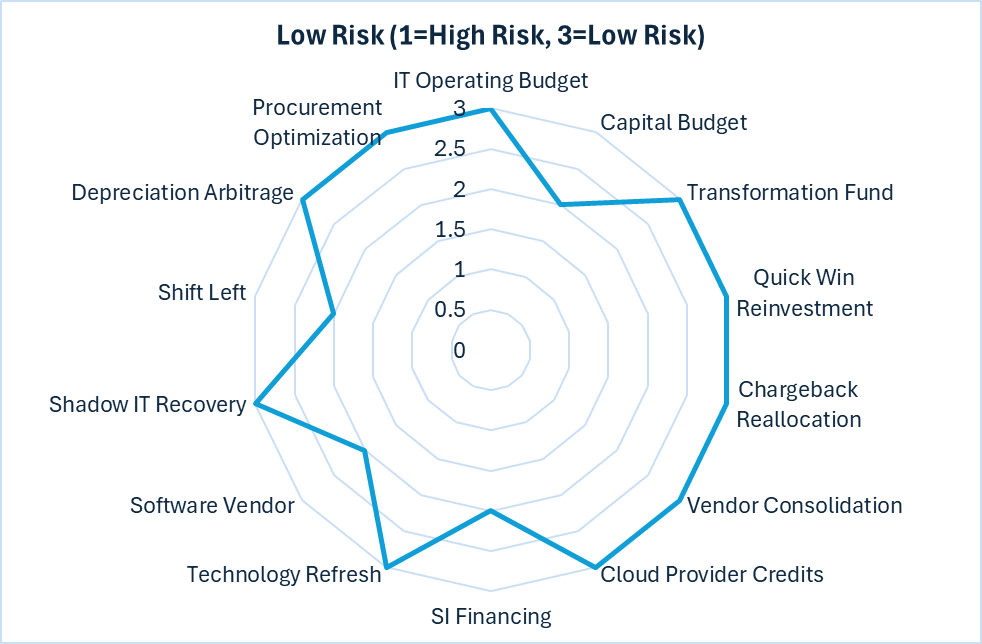
FINANCING DECISION MATRIX
| Financing Method | Speed | Amount | Approval | Risk | Best For |
| IT Operating Budget | Slow | Low-Med | Easy | Low | Small programs |
| Capital Budget | Medium | High | Hard | Medium | Strategic initiatives |
| Transformation Fund | Medium | High | Medium | Low | Formal programs |
| Quick Win Reinvestment | Slow | Medium | Easy | Low | Proof of concept |
| Chargeback Reallocation | Medium | Medium | Medium | Low | Decentralized orgs |
| Vendor Consolidation | Fast | Medium | Easy | Low | Fragmented vendors |
| Cloud Provider Credits | Fast | Medium | Easy | Low | Cloud migrations |
| SI Financing | Fast | High | Medium | Medium | No capital available |
| Technology Refresh | Medium | High | Medium | Low | Infrastructure refresh |
| Software Vendor | Fast | Medium | Easy | Medium | Platform consolidation |
| Shadow IT Recovery | Fast | Medium | Easy | Low | Poor governance |
| Shift Left | Medium | Medium | Medium | Medium | High tech debt |
| Depreciation Arbitrage | Slow | Low | Easy | Low | Old infrastructure |
| Procurement Optimization | Medium | Medium | Easy | Low | Overpaying vendors |
Conclusion
In the first part of Application Rationalization we looked comprehensively at the program requirements, Rationalization and modernization methods,. Financing options and organizational roles in it’s success. In the second part we will discuss Application Portfolio Rationalization: Comprehensive Guide by Portfolio Segment